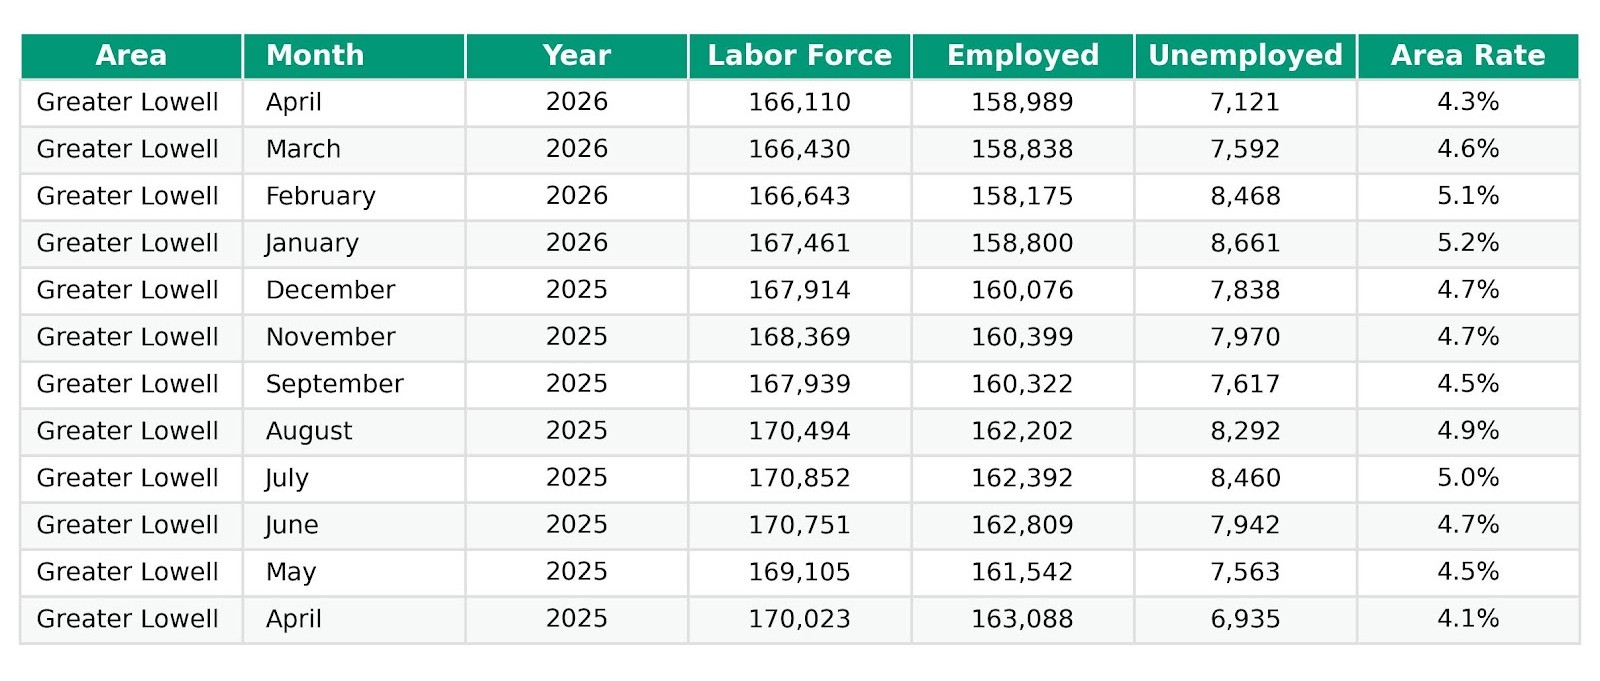
Greater Lowell Workforce Area Unemployment Rate
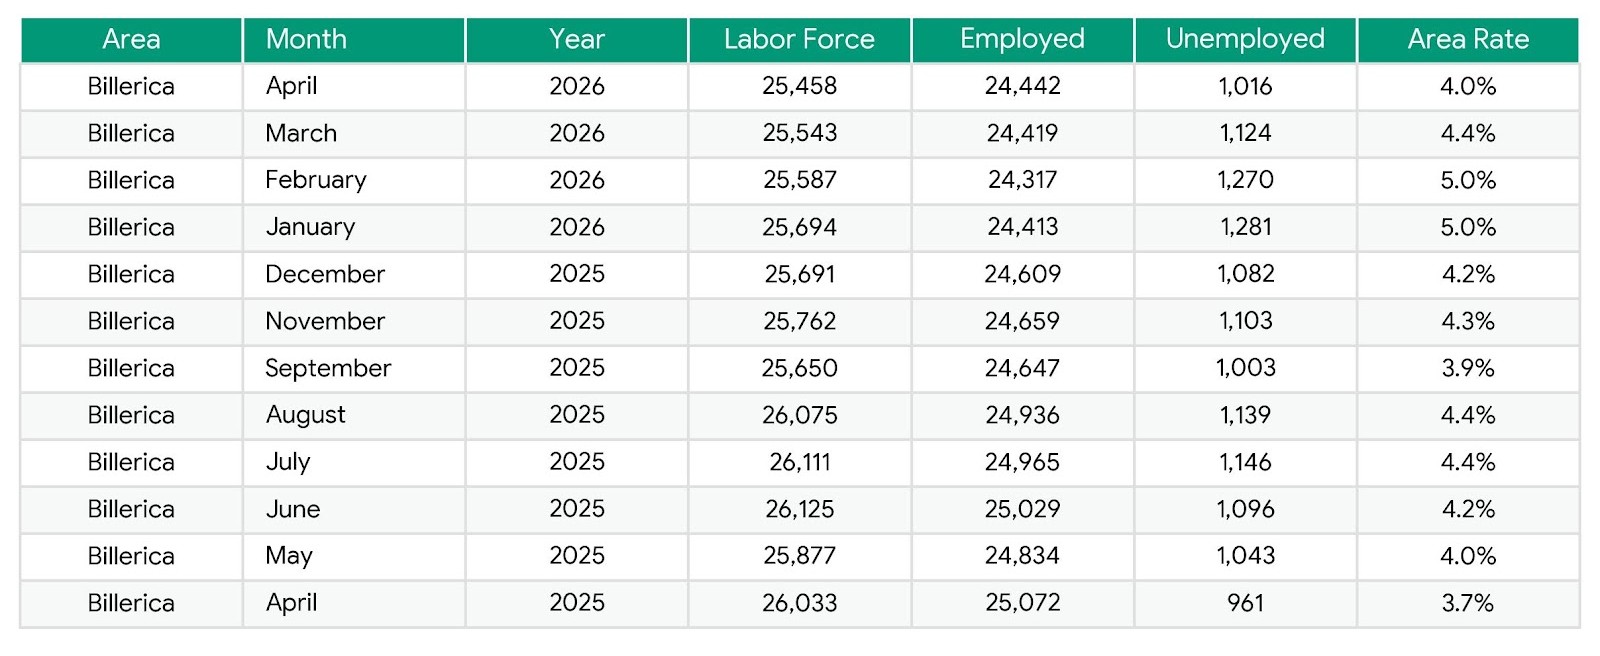
Billerica Unemployment Rate
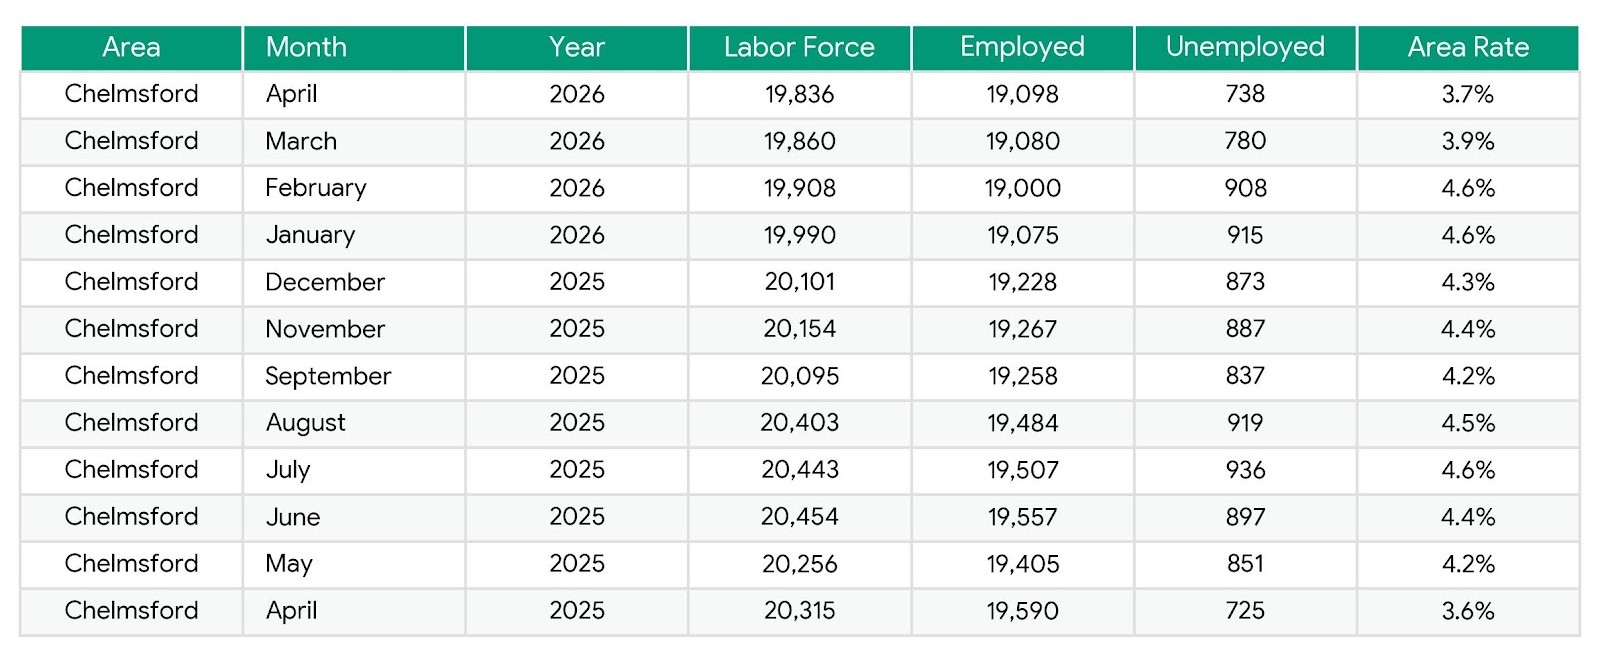
Chelmsford Unemployment Rate
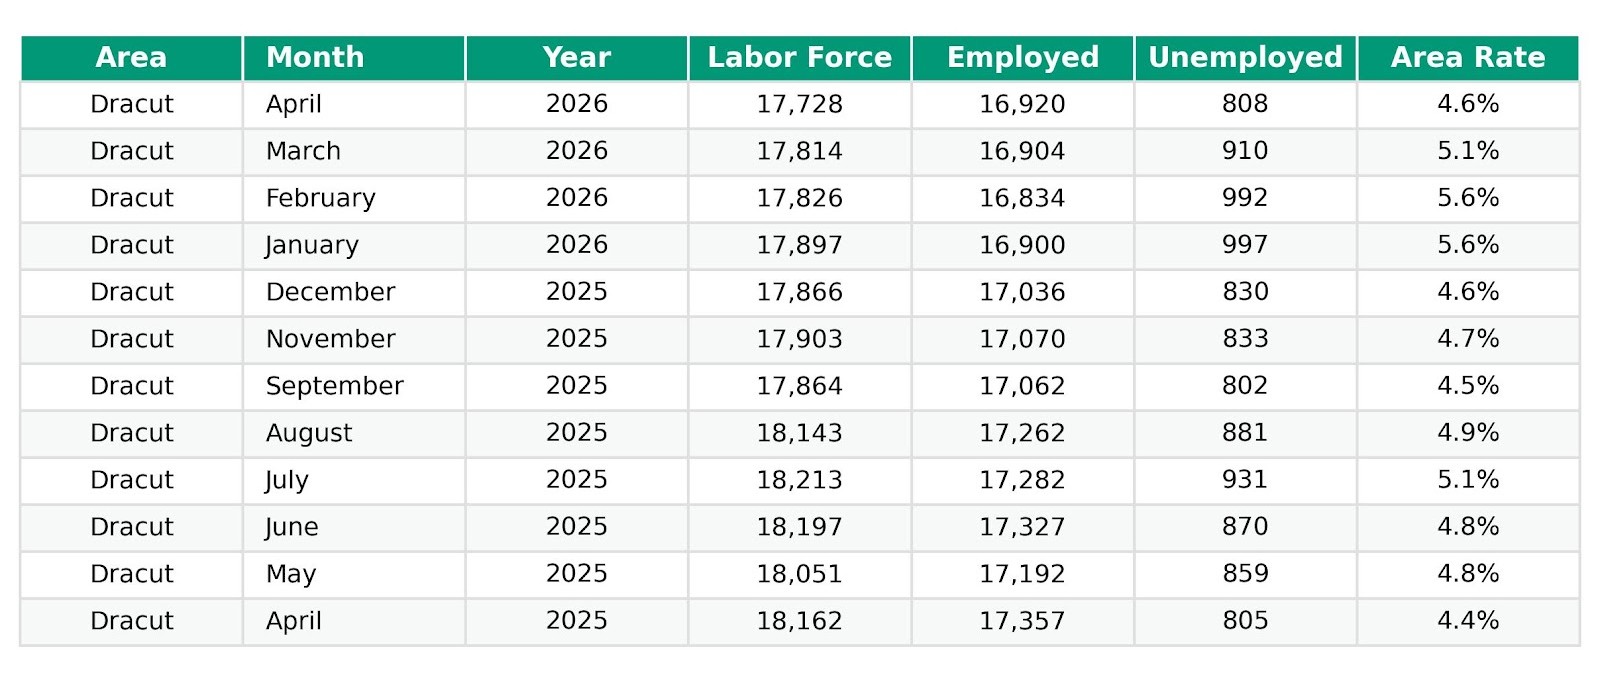
Dracut Unemployment Rate
Dunstable Unemployment Rate

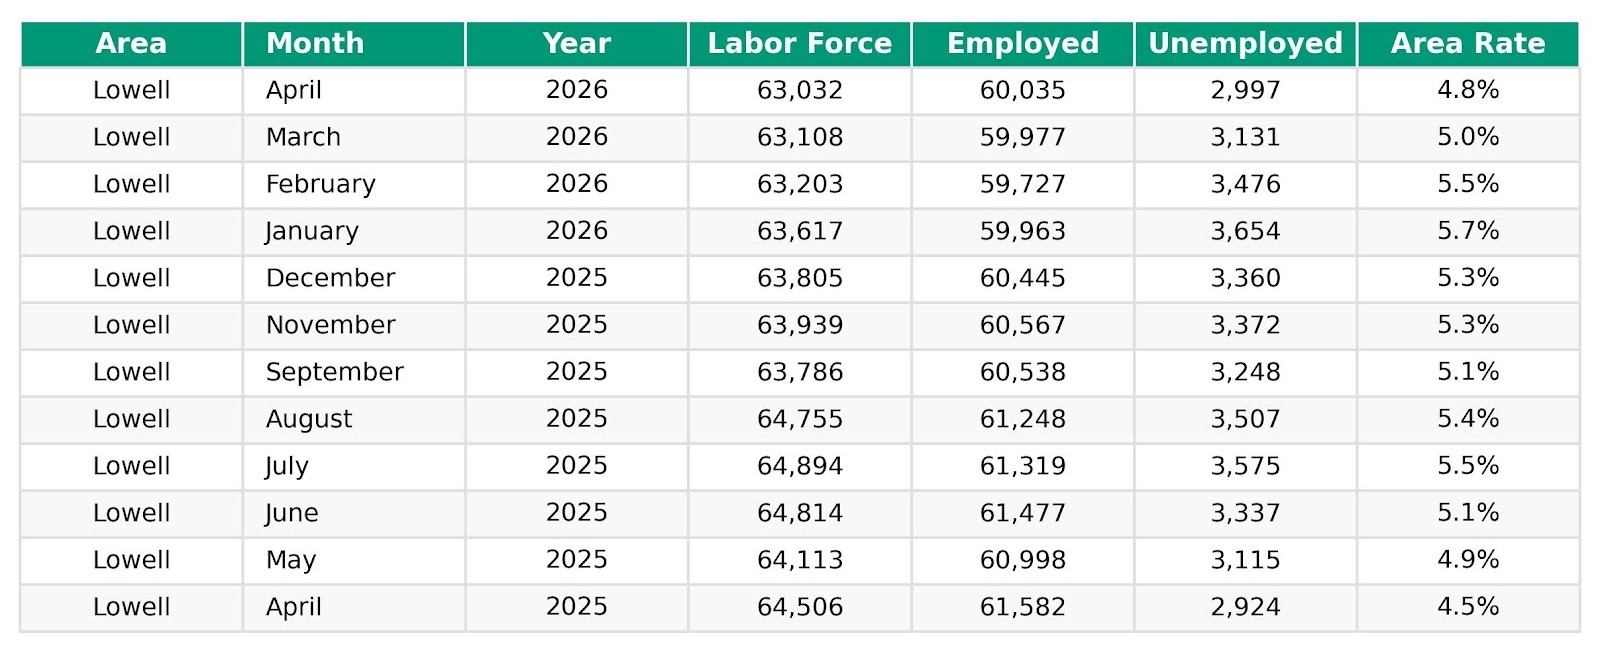
Lowell Unemployment Rate
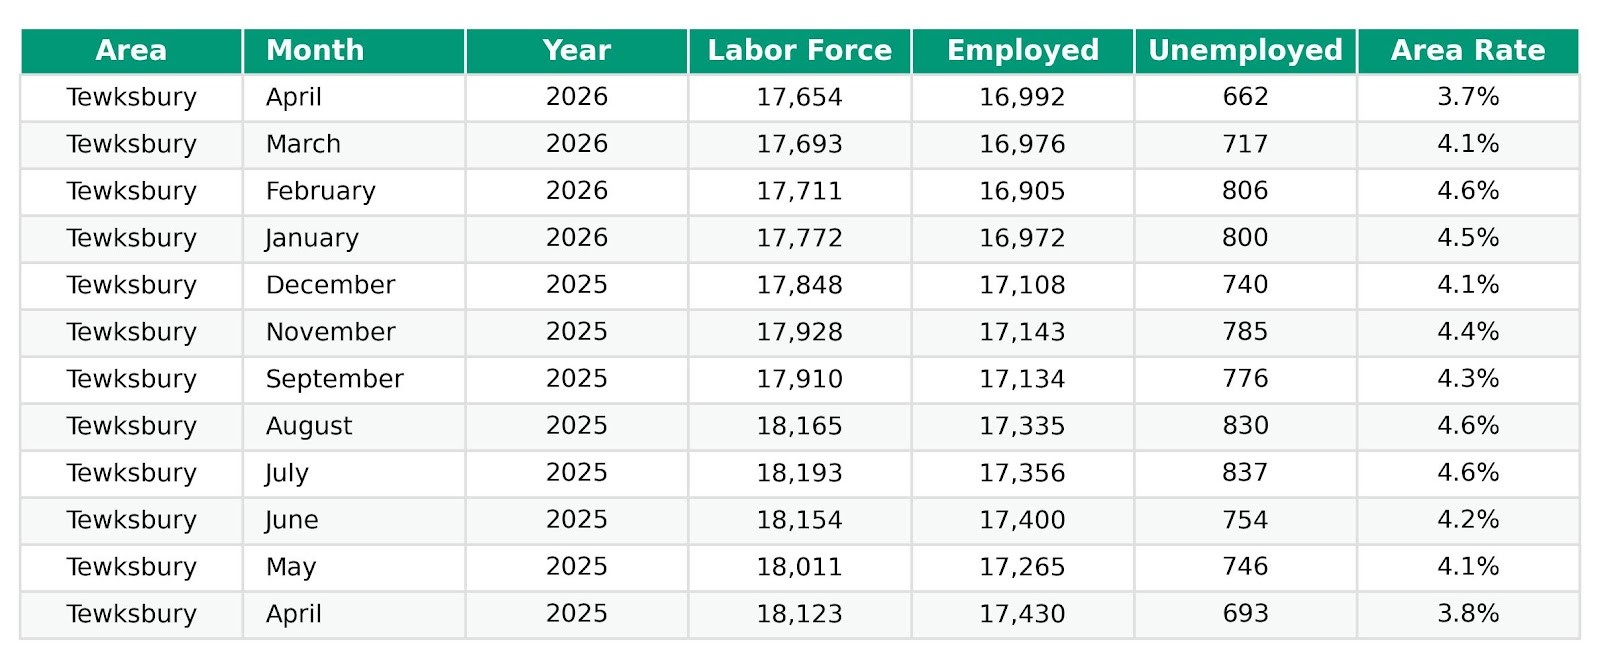
Tewksbury Unemployment Rate
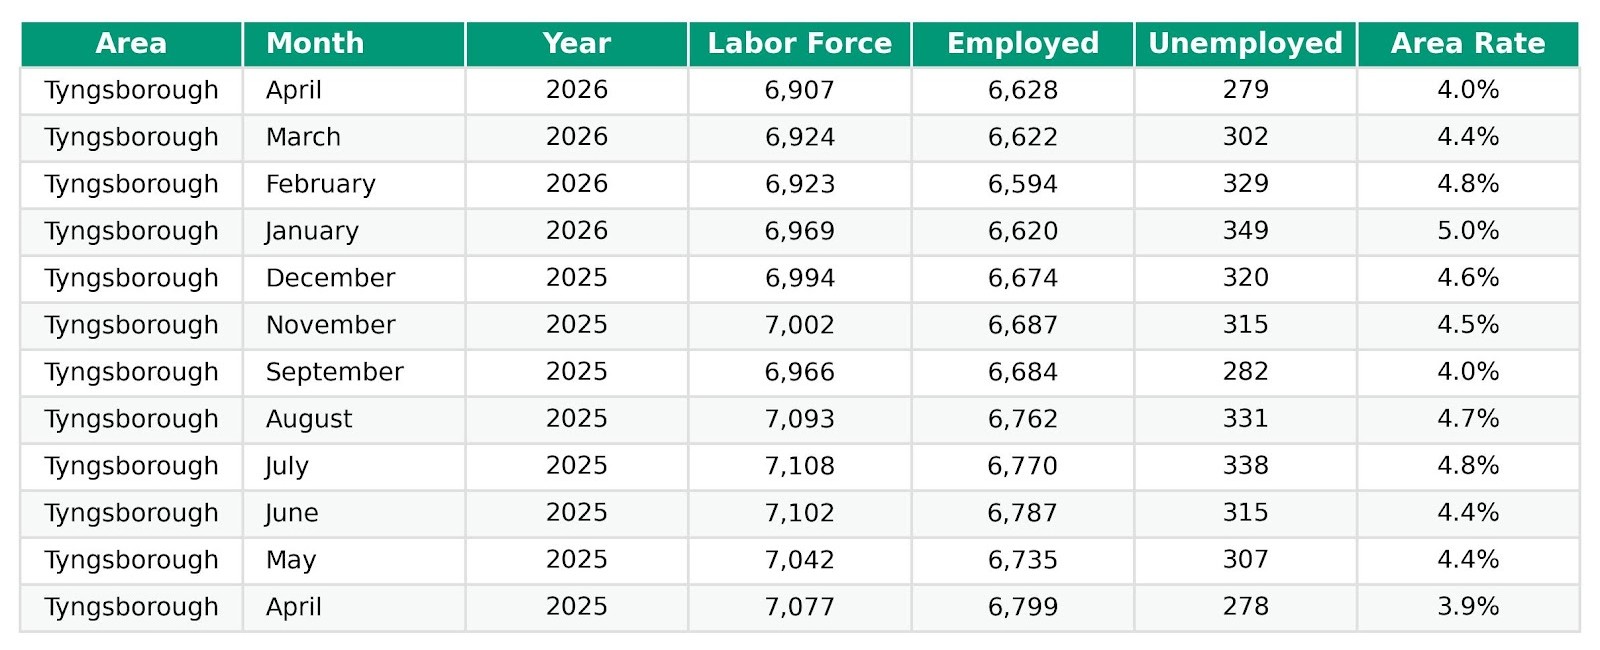
Tyngsboro Unemployment Rate
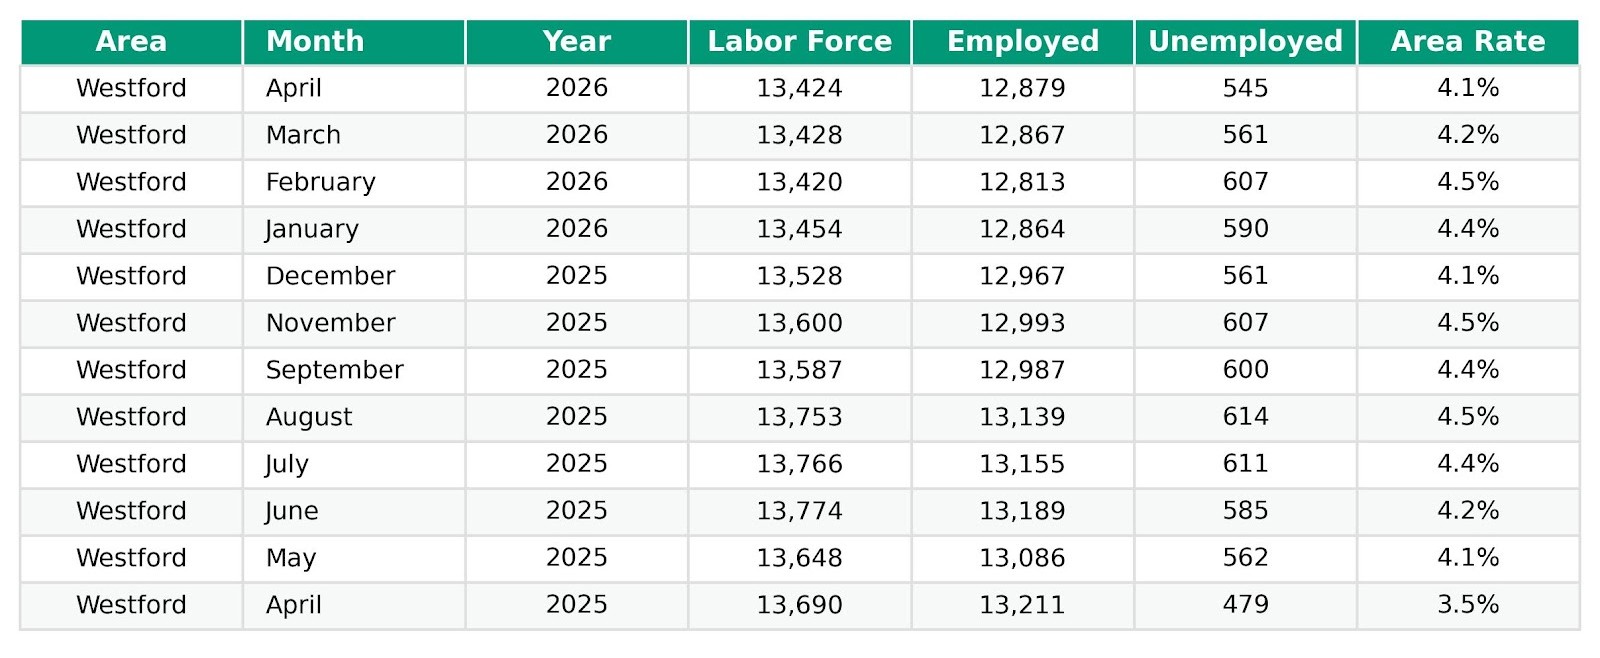
Westford Unemployment Rate